Example #1
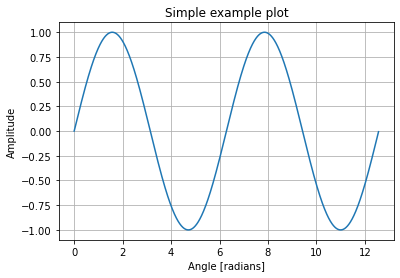
This is simple example that create a simple plot using matplotlib
[5]:
import matplotlib.pyplot as plt
import numpy as np

# Data for plotting
x = np.arange(0.0, 4 * np.pi, 0.01)

fig, ax = plt.subplots()
ax.plot(x, np.sin(x))

ax.set(xlabel='Angle [radians]', ylabel='Amplitude',
       title='Simple example plot')
ax.grid()
plt.show()
[ ]: